Voting Matters
VOTER REGISTRATION DEADLINE – OCT. 7
Why Vote?
Voting allows each of us to have a say in shaping the policies and future of our communities, cities, and country. When we vote, we select representatives who make key decisions that shape laws and policies affecting our daily lives. Voting is not only a right but also an essential part of being an engaged citizen.
Health Equity
At NOAH, we are committed to providing quality healthcare for everyone. Health equity means that all people—regardless of race, gender, sexual orientation, disability, income, or location—have fair access to healthcare and the resources they need to achieve their highest potential for health.
Statistically, the populations that are farthest from achieving health equity are the populations who are underrepresented at the polls. Many don’t or cannot vote for a variety of reasons including:
- Not registered or improperly registered to vote
- Unable to form an opinion based on available information
- Distrust in the system
- Belief that one vote cannot make a difference
Historical Voting Data
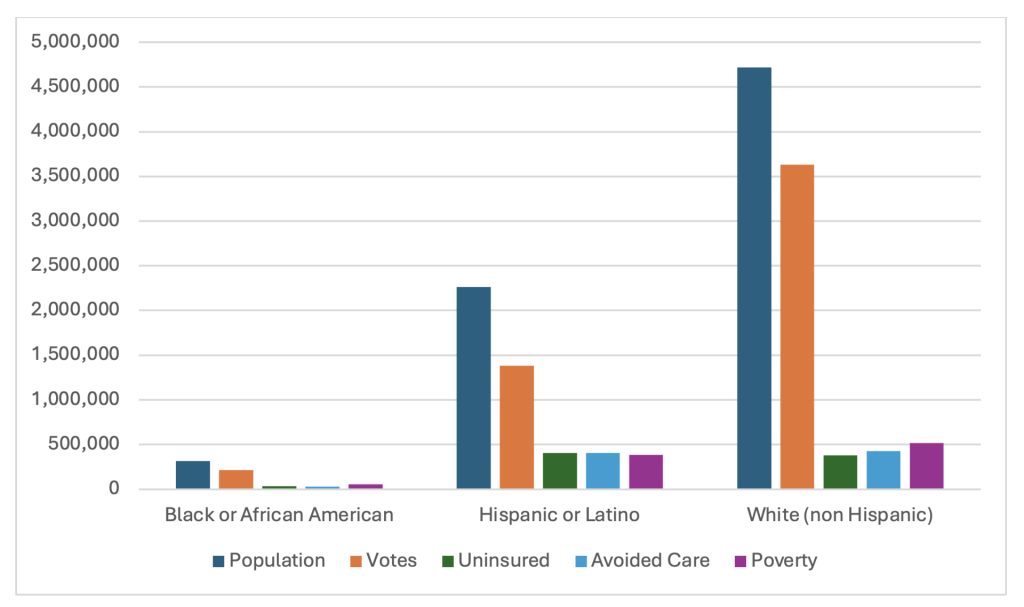
Voter participation data is limited, however, using metrics from Satcher Health Leadership Institute at the Morehouse School of Medicine’s Health Equity Tracker, we were able to compare number of votes and other variables in three ethnic groups for U.S. Citizens, age 18 and up living in Arizona.
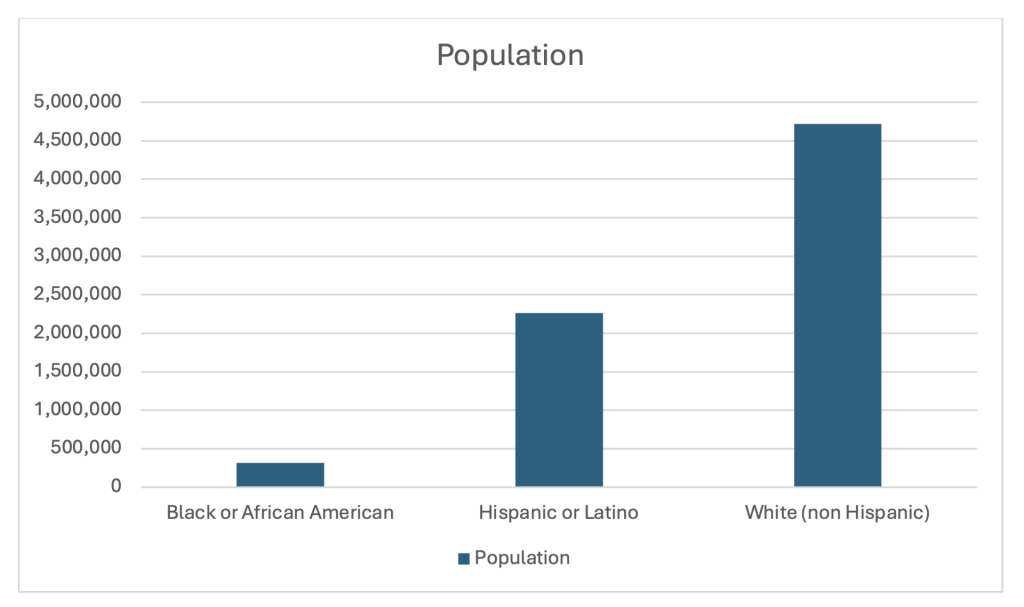
Population Eligible to Vote
This chart shows the number of people who are eligible to vote in these population groups.
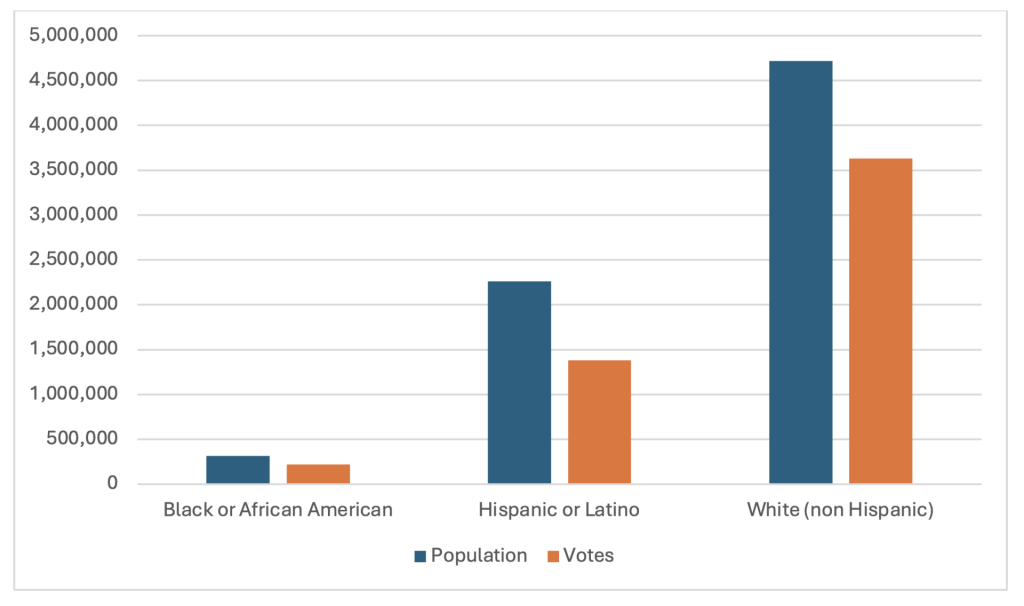
Voting Population
Now, we can see the portion of each population that is voting.
Uninsured
Layering in the number of people who do not have health insurance we see a higher percentage of uninsured Hispanic and Latino individuals, but far fewer are voting. How might a proposition for affordable health insurance perform in this scenario?

Avoided Care Due to Cost
The same issue applies in this chart that shows the number of people in each population that avoided healthcare due to cost.

Poverty Level and Below
When we look at all these factors—voter turnout, uninsured rates, healthcare avoidance due to cost, and poverty—we see that many who are affected by these issues may not have their voices heard.
Poor Representation
While this is a small sample of health disparities and voting populations, it helps illustrate how the majority vote in this scenario may not fully represent the opinions of those who are impacted most.
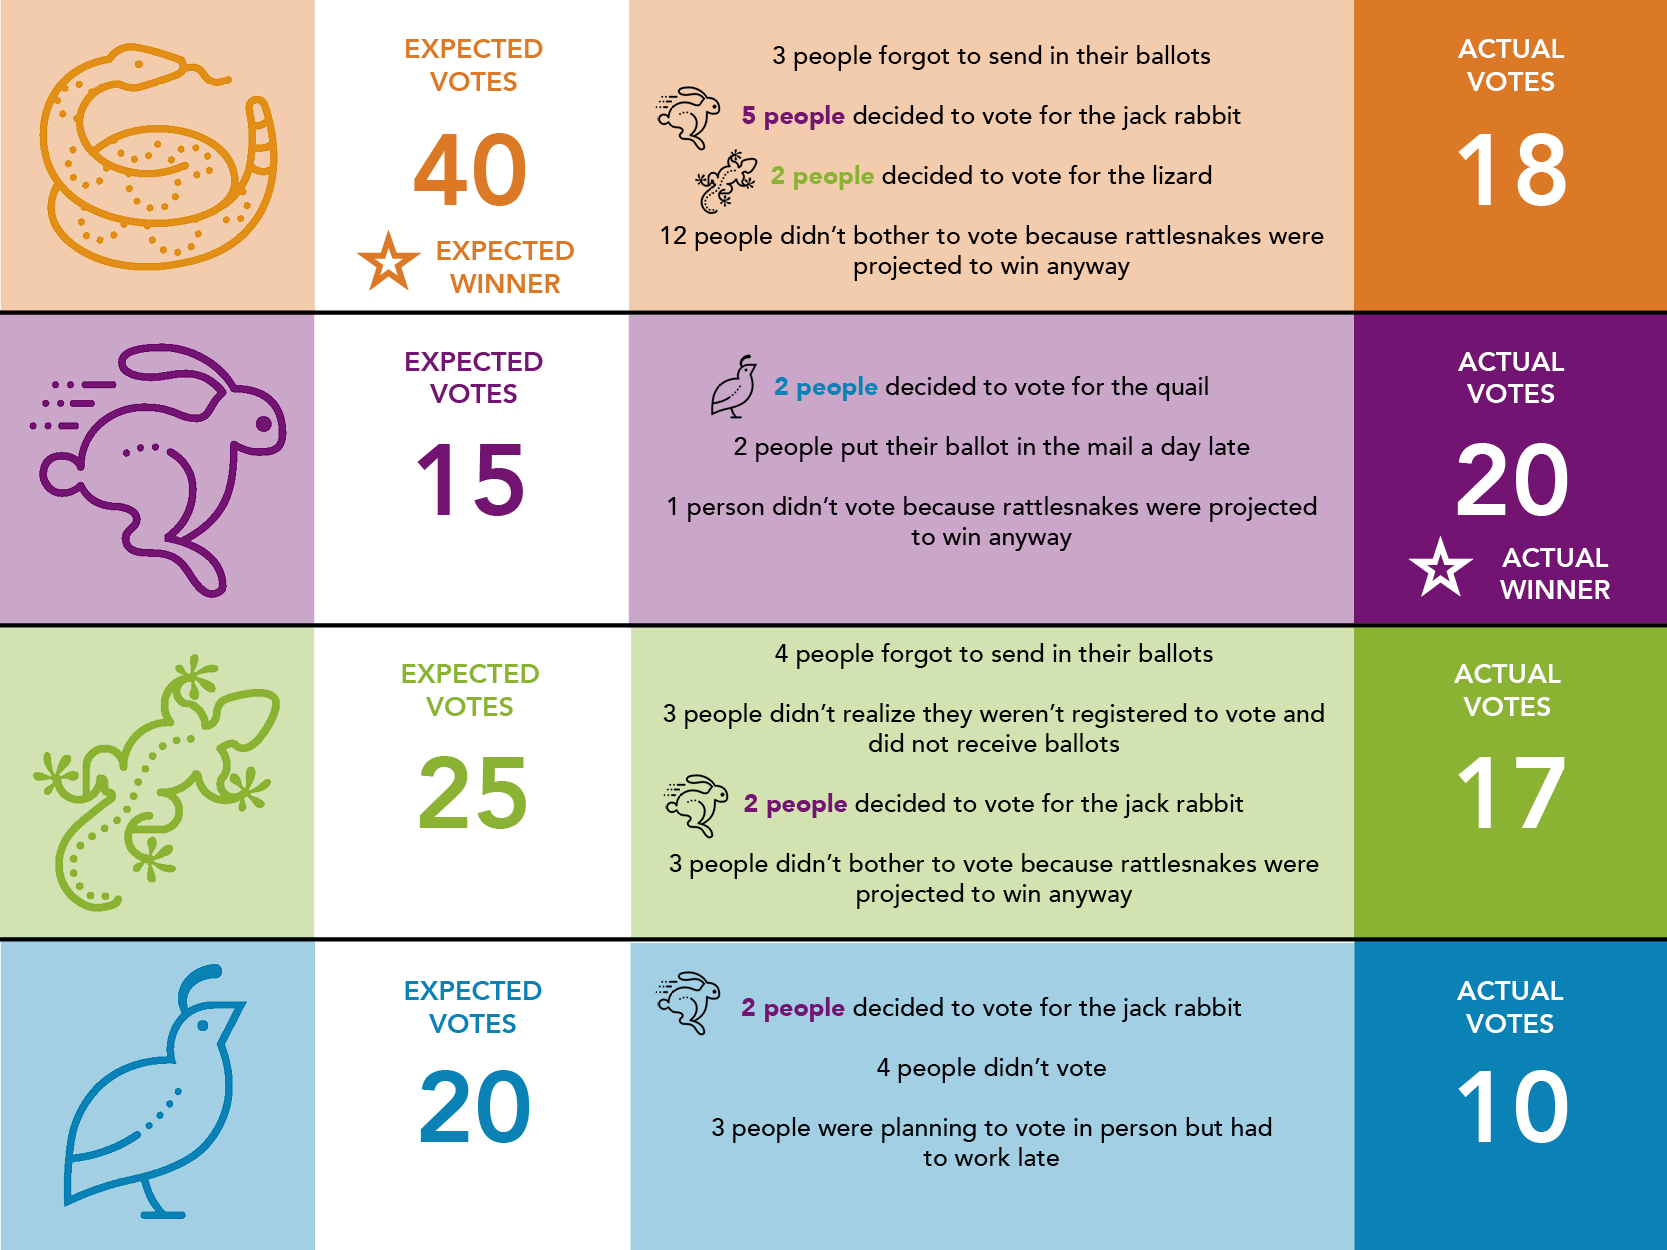
A Make-Believe Election
Using some made-up data, let’s see how voter-participation shakes out in an election. For example, NOAH decides to add a desert animal to their pack and 100 people are eligible to vote. By viewing the expected votes on the left hand side of the graphic below, you can easily see the rattlesnake is the expected winner, but watch what happens as the votes are tallied:
Just Vote
Regardless of how you vote or what influences your choices, your vote is your chance to be heard. As Thomas Jefferson once said,
“We do not have government by the majority. We have government by the majority who participate.”
Thomas Jefferson